Self-Paced Online learning
24/7 Online Support
14 days Money Back Guarantee
Fully Accredited Courses

Data Analysis for Beginners: Understand, Interpret & Visualize Data

4.9

(1641 students)
Last updated:May 16, 2025
Language:English

Data Analysis for Beginners: Understand, Interpret & Visualize Data

4.9

(1641 students)
qls-logo cpd-logo cpd-logo ukrlp-logo iphm-logo

Rated Excellent on

google-logo

This online course provides a comprehensive Data Analysis for Beginners: Understand, Interpret & Visualize Data, focusing on key tools, techniques, and concepts that enable professionals to interpret and use data for process management and improvement. Through this course, you will learn how to apply various analysis tools such as the Pareto Chart, Histogram, Run Chart, and Control Chart, while exploring principles like the Voice of the Customer and understanding variation. By the end of the course, you will have gained the skills needed to leverage data to drive continuous improvement.

By the end of this course, you will:

  1. Understand the fundamental principles of data analysis and process management.
  2. Learn how to interpret and present performance data using various charts and tools.
  3. Master key data analysis tools, including Pareto Charts, Histograms, Run Charts, and Control Charts.
  4. Understand the importance of variation in data and how to interpret it.
  5. Learn strategies for dealing with variation and using data to drive improvement.
  6. Gain the skills to measure performance and make data-driven decisions.

Enrolling in this course will provide you with essential skills to analyze data, understand variation, and apply data-driven strategies to improve processes. Whether you’re a beginner or looking to refine your data analysis skills, this course is ideal for professionals in process management, quality control, or anyone looking to leverage data in their work. By the end of the course, you will be equipped with the knowledge and tools needed to use data to enhance decision-making and drive business improvements.

This course is ideal for anyone looking to start or enhance their career in data analysis. It is perfect for:

  • Individuals who are new to data analysis and want to understand the basic principles and tools.
  • Professionals in process management, quality control, or business management seeking to apply data analysis to improve processes.
  • Business analysts, data analysts, or any professional looking to gain foundational data analysis skills to enhance their decision-making and performance measurement.

There are no specific entry requirements for this course. It is suitable for:

  • Beginners looking to improve their data analysis skills for personal or professional use.
  • Professionals interested in applying data analysis techniques in process management or quality control.
  • Individuals seeking to learn the fundamental tools and strategies of data analysis to drive improvement in business processes.

Upon completing the course and passing the final exam, you will receive a CPD QS Accredited Certificate from Apex Learning. This certification demonstrates your knowledge and skills as a nursing assistant in the UK. The Digital version of the certificate is available for £9.99 only, and you can order a hard copy of the certificate for £14.99 only.

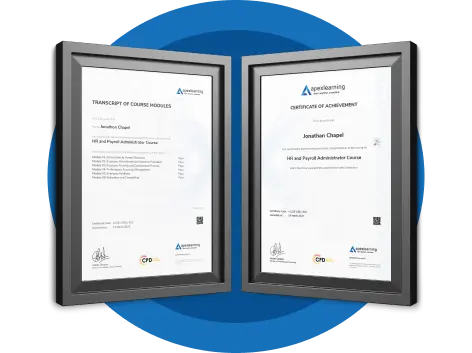
Apex - CPD QS Certificate Image

Upon completing the Data Analysis for Beginners: Understand, Interpret & Visualize Data course, you will have the skills to pursue roles such as:

  • Data Analyst: Analyze data to help organizations make informed decisions and improve processes.
    Average UK Salary: £30,000 – £45,000 per year.
  • Process Improvement Specialist: Use data to identify inefficiencies and implement improvements in business processes.
    Average UK Salary: £35,000 – £50,000 per year.
  • Business Analyst: Work with stakeholders to improve business processes, using data analysis techniques to optimize performance.
    Average UK Salary: £40,000 – £55,000 per year.
  • Quality Control Analyst: Monitor and analyze data to ensure product or service quality meets standards. Average UK Salary: £30,000 – £45,000 per year.

Data Analysis for Beginners: Understand, Interpret & Visualize Data | CPD Accredited Data Analysis Course Online - UK

The Data Analysis for Beginners: Understand, Interpret & Visualize Data course is designed for individuals looking to gain foundational knowledge in data analysis techniques. Whether you’re starting in data analysis, looking to enhance your skills, or seeking to apply data analysis in your career, this course will provide you with the tools and methodologies you need to effectively work with data. Learn how to interpret, analyze, and use data to drive improvement and inform decision-making processes.

Course Overview
This online course provides a comprehensive Data Analysis for Beginners: Understand, Interpret & Visualize Data, focusing on key tools, techniques, and concepts that enable professionals to interpret and use data for process management and improvement. Through this course, you will learn how to apply various analysis tools such as the Pareto Chart, Histogram, Run Chart, and Control Chart, while exploring principles like the Voice of the Customer and understanding variation. By the end of the course, you will have gained the skills needed to leverage data to drive continuous improvement.

Learning Outcomes

By the end of this course, you will:

  1. Understand the fundamental principles of data analysis and process management.
  2. Learn how to interpret and present performance data using various charts and tools.
  3. Master key data analysis tools, including Pareto Charts, Histograms, Run Charts, and Control Charts.
  4. Understand the importance of variation in data and how to interpret it.
  5. Learn strategies for dealing with variation and using data to drive improvement.
  6. Gain the skills to measure performance and make data-driven decisions.

Why Enrol in This Course?

 Enrolling in this course will provide you with essential skills to analyze data, understand variation, and apply data-driven strategies to improve processes. Whether you’re a beginner or looking to refine your data analysis skills, this course is ideal for professionals in process management, quality control, or anyone looking to leverage data in their work. By the end of the course, you will be equipped with the knowledge and tools needed to use data to enhance decision-making and drive business improvements.

Who is This Course for?

This course is ideal for anyone looking to start or enhance their career in data analysis. It is perfect for:

  • Individuals who are new to data analysis and want to understand the basic principles and tools.
  • Professionals in process management, quality control, or business management seeking to apply data analysis to improve processes.
  • Business analysts, data analysts, or any professional looking to gain foundational data analysis skills to enhance their decision-making and performance measurement.

Prerequisites

There are no specific entry requirements for this course. It is suitable for:

  • Beginners looking to improve their data analysis skills for personal or professional use.
  • Professionals interested in applying data analysis techniques in process management or quality control.
  • Individuals seeking to learn the fundamental tools and strategies of data analysis to drive improvement in business processes.

Assessment Method

Assessment for the course is conducted through an automated multiple-choice exam. A score of 60% is required to pass and earn the CPD Accredited Certificate. Reflective assignments are provided to enhance your learning, with expert tutor feedback available.

Certification

Upon completing the course and passing the final exam, you will receive a CPD QS Accredited Certificate from Apex Learning. This certification demonstrates your knowledge and skills as a nursing assistant in the UK. The Digital version of the certificate is available for £9.99 only, and you can order a hard copy of the certificate for £14.99 only.

Apex - CPD QS Certificate Image

Career Path

 Upon completing the Data Analysis for Beginners: Understand, Interpret & Visualize Data course, you will have the skills to pursue roles such as:

  • Data Analyst: Analyze data to help organizations make informed decisions and improve processes.
    Average UK Salary: £30,000 – £45,000 per year.
  • Process Improvement Specialist: Use data to identify inefficiencies and implement improvements in business processes.
    Average UK Salary: £35,000 – £50,000 per year.
  • Business Analyst: Work with stakeholders to improve business processes, using data analysis techniques to optimize performance.
    Average UK Salary: £40,000 – £55,000 per year.
  • Quality Control Analyst: Monitor and analyze data to ensure product or service quality meets standards. Average UK Salary: £30,000 – £45,000 per year.

Frequestly Asked Questions

Data analysis training provides individuals with the skills and techniques needed to collect, interpret, and present data in a meaningful way. This training covers various tools and methods used to understand trends, variations, and performance, helping individuals make data-driven decisions.

The Data Analysis for Beginners: Understand, Interpret & Visualize Data covers the basics of how to collect, interpret, and use data to inform decisions. It involves understanding key concepts, tools, and techniques to analyze data for process improvement and decision-making.

 The four types of data analysis are: Descriptive, Diagnostic, Predictive, and Prescriptive. Descriptive analysis focuses on summarizing data, diagnostic analysis identifies causes, predictive analysis forecasts future trends, and prescriptive analysis recommends actions based on data insights.

 The basics of data analysis include collecting and organizing data, identifying patterns or trends, using statistical techniques to interpret the data, and presenting findings in a clear and actionable format. Tools like Excel, databases, and visualization techniques are often used to assist in data analysis.

When writing an introduction for data analysis, begin by explaining the purpose of the analysis, the data being used, and the main questions or problems being addressed. Briefly describe the methods and tools that will be used to analyze the data and the expected outcomes.

Yes, this course is ideal for beginners. It covers the fundamental concepts of data analysis and gradually introduces more advanced tools, making it accessible to anyone interested in learning data analysis, regardless of their prior experience.

Upon successful completion of this course, you will receive a CPD-accredited certificate in Data Analysis for Beginners: Understand, Interpret & Visualize Data, demonstrating your understanding of data analysis tools and techniques.

 Yes, this course is fully accessible on any device, including mobile phones, allowing you to learn at your convenience, wherever you are.

You can purchase the course directly through our website. Once you complete your purchase, you will gain instant access to the course materials and start learning right away.

 This course will teach you how to use key data analysis tools such as Pareto Charts, Histograms, Run Charts, and Control Charts. You will also learn how to present performance data and apply strategies to drive improvement using data.

 No, there are no prerequisites for this course. It is suitable for beginners and those looking to refresh or enhance their data analysis skills.

Course Curriculum

  • 4 sections
  • 8 lectures
  • 00:00:00 total length
Expand all sections
  • video Module 01: Introduction
    00:02:00
  • video Module 02: Agenda and Principles of Process Management
    00:06:00
  • video Module 03: The Voice of the Process
    00:05:00
  • video Module 04: Working as One Team for Improvement
    00:04:00
  • video Module 05: Exercise: The Voice of the Customer
    00:03:00
  • video Module 06: Tools for Data Analysis
    00:07:00
  • video Module 07: The Pareto Chart
    00:03:00
  • video Module 08: The Histogram
    00:03:00
  • video Module 09: The Run Chart
    00:04:00
  • video Module 10: Exercise: Presenting Performance Data
    00:05:00
  • video Module 11: Understanding Variation
    00:06:00
  • video Module 12: The Control Chart
    00:06:00
  • video Module 13: Control Chart Example
    00:04:00
  • video Module 14: Control Chart Special Cases
    00:06:00
  • video Module 15: Interpreting the Control Chart
    00:10:00
  • video Module 16: Control Chart Exercise
    00:07:00
  • video Module 17: Strategies to Deal with Variation
    00:06:00
  • video Module 18: Using Data to Drive Improvement
    00:14:00
  • video Module 19: A Structure for Performance Measurement
    00:06:00
  • video Module 20: Data Analysis Exercise
    00:06:00
  • video Module 21: Course Project
    00:03:00
  • video Module 22: Test your Understanding
    00:17:00

Data Analysis for Beginners: Understand, Interpret & Visualize Data

Save 95% - Sale Ends in

14 Days Money Back Guarantee

Frequently Bought Together

avatar

AutoCAD MasterClass

£21.99

4.4

(3 students)
avatar

Complete Teaching Assistant Diploma Level 3 (TA, SEN, Autism, ADHD & Dyslexia)

£21.99

4.8

(1793 students)

4.9 course rating - 14 reviews

Rodrigo Castro
Very helpful. I'll do more courses.
Inioluwa Mafe
The videos are very well explained and also engaging.
Chimere Anyiam
Awesome learning experience
Data Analysis for Beginners: Understand, Interpret & Visualize Data

£21.99

Regular Price

£419

Save 95% - Sale Ends in

14 Days Money Back Guarantee

This course includes:

  • Duration:
    2 hours, 13 minutes
  • Access:
    1 year access
  • Level:
  • CPD Points:
    10
× How can I help you?