



Self-Paced Online learning
24/7 Online Support
14 days Money Back Guarantee
Fully Accredited Courses

Microsoft Excel: Automated Dashboard Using Advanced Formula, VBA, Power Query

5

(1582 students)
Bestseller Great Service Highly Rated Trending
Last updated: July 3, 2026
Language: English

Microsoft Excel: Automated Dashboard Using Advanced Formula, VBA, Power Query

5

(1582 students)
qls-logo cpd-logo cpd-logo ukrlp-logo iphm-logo

Rated Excellent on

google-logo

UNLOCK THIS COURSE AND 3000+ OTHER COURSES FOR ONLY £99! FIND OUT MORE

Master the skills of a Microsoft Excel professional online — from advanced formulas to automated dashboards with VBA and Power Query.

Looking to streamline reporting, enhance data analysis, and create dynamic dashboards in Microsoft Excel? The Microsoft Excel: Automated Dashboard Using Advanced Formula, VBA, Power Query course is a CPD-accredited online programme designed for accountants, analysts, and business professionals who want to automate Excel dashboards, understand complex formulas, and use Power Query for efficient reporting.

With Excel remaining the most widely used tool for business intelligence in the UK, 87% of UK companies report a reliance on advanced Excel skills for reporting and analytics. This Microsoft Excel Advanced Dashboard Course covers formula-based prepaid expense models, VBA scripting, Power Query, Pivot Tables, and dynamic dashboard creation. By completing this course, learners gain confidence in handling complex data structures and designing automated dashboards aligned with professional standards.

Course Overview

Structured into comprehensive modules, this Microsoft Excel: Automated Dashboard Using Advanced Formula, VBA, Power Query covers essential Excel concepts and advanced automation techniques, including:

  • Formula‑based prepaid expenses modelling and analysis
  • Advanced Excel functions for data structuring and calculation logic
  • VBA scripting principles to understand automation logic
  • Dashboard components and design theory for reporting
  • Power Query concepts for data transformation and query loading
  • Pivot Table logic for summarising and analysing datasets
  • Techniques for dynamic reporting without manual formula use
  • Downloadable example resources to support your study

Each module is designed to help learners understand the principles behind Excel’s advanced capabilities, enabling you to conceptualise automation logic and reporting workflows used in accounting, business analysis, and data management.

Whether you’re enhancing your professional reporting skills, improving financial model thinking, or strengthening your Excel knowledge for career growth, this Excel automation and dashboard course provides a solid foundation. It’s suitable for learners seeking CPD‑aligned training in advanced formulas, VBA logic, and Power Query understanding. Enrol today!

By the end of this Microsoft Excel: Automated Dashboard Using Advanced Formula, VBA, Power Query, you will be able to:

  • Apply advanced Excel formulas for financial and data models
  • Use VBA to automate repetitive spreadsheet tasks
  • Generate dynamic dashboards using Power Query and Pivot Tables
  • Structure and analyse complex datasets in Excel efficiently
  • Design automated reporting templates for professional use
  • Understand data workflow and dashboard logic for business reporting
  • Enhance productivity in accounting, finance, and business intelligence roles

This Microsoft Excel: Automated Dashboard Using Advanced Formula, VBA, Power Query is ideal for professionals seeking to enhance their Excel capabilities beyond basic functions. It offers insights on automating financial models and creating interactive dashboards that can save time and improve reporting accuracy.

You’ll benefit from:

  • CPD-certified training tailored to accounting and data analysis professionals
  • Downloadable resources to practice and apply your skills
  • Flexible online learning with lifetime access

This Microsoft Excel: Automated Dashboard Using Advanced Formula, VBA, Power Query is suitable for:

  • Accountants and finance professionals
  • Business analysts and BI professionals
  • Data analysts managing reports and dashboards
  • Professionals automating financial and operational reporting
  • Excel users seeking CPD-accredited advanced training
  • Career switchers or students pursuing finance, analytics, or BI roles

This Microsoft Excel: Automated Dashboard Using Advanced Formula, VBA, Power Query requires no prior experience to enrol. However, familiarity with formulas and Pivot Tables will help you get the most from this course.

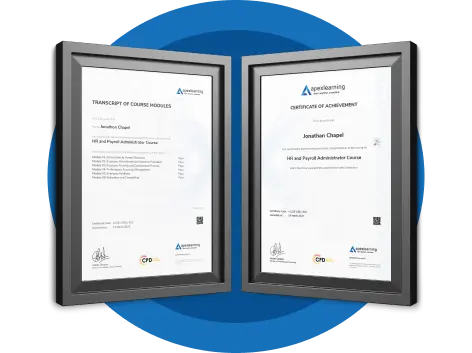
Upon completing the course and passing the final exam, you will receive a CPD QS Accredited Certificate from Apex Learning. This certification demonstrates your knowledge and skills as a nursing assistant in the UK. The Digital version of the certificate is available for £9.99 only, and you can order a hard copy of the certificate for £14.99 only.

Apex - CPD QS Certificate Image

Completing this Microsoft Excel: Automated Dashboard Using Advanced Formula, VBA, Power Query can enhance career prospects for Excel and data-focused roles in the UK. The following roles are commonly associated:

  • Financial Analyst – Build automated financial reports and dashboards.
    Average salary: £28,000 – £45,000
  • Business Intelligence Analyst – Develop dashboards and data visualisations to support business decisions.
    Average salary: £30,000 – £50,000
  • Accountant – Automate accounting tasks and financial reporting processes.
    Average salary: £25,000 – £40,000
  • Data Analyst – Analyse and interpret complex datasets with advanced Excel tools.
    Average salary: £27,000 – £45,000
  • Management Accountant – Design reporting templates and financial models for managerial decisions.
    Average salary: £30,000 – £48,000
  • Operations Analyst – Use Excel dashboards to monitor operational efficiency.
    Average salary: £30,000 – £50,000
  • Finance Officer – Apply advanced Excel for budget tracking and reporting.
    Average salary: £28,000 – £42,000
  • Reporting Analyst – Generate automated reports and visual dashboards for teams.
    Average salary: £30,000 – £45,000
  • Business Analyst – Extract actionable insights using Excel-based models.
    Average salary: £32,000 – £50,000
  • Project Analyst – Track project KPIs and automate reporting processes.
    Average salary: £30,000 – £48,000

Microsoft Excel: Automated Dashboard Using Advanced Formula, VBA, Power Query

Master the skills of a Microsoft Excel professional online — from advanced formulas to automated dashboards with VBA and Power Query.

Looking to streamline reporting, enhance data analysis, and create dynamic dashboards in Microsoft Excel? The Microsoft Excel: Automated Dashboard Using Advanced Formula, VBA, Power Query course is a CPD-accredited online programme designed for accountants, analysts, and business professionals who want to automate Excel dashboards, understand complex formulas, and use Power Query for efficient reporting.

With Excel remaining the most widely used tool for business intelligence in the UK, 87% of UK companies report a reliance on advanced Excel skills for reporting and analytics. This Microsoft Excel Advanced Dashboard Course covers formula-based prepaid expense models, VBA scripting, Power Query, Pivot Tables, and dynamic dashboard creation. By completing this course, learners gain confidence in handling complex data structures and designing automated dashboards aligned with professional standards.

Course Overview

Structured into comprehensive modules, this Microsoft Excel: Automated Dashboard Using Advanced Formula, VBA, Power Query covers essential Excel concepts and advanced automation techniques, including:

  • Formula‑based prepaid expenses modelling and analysis
  • Advanced Excel functions for data structuring and calculation logic
  • VBA scripting principles to understand automation logic
  • Dashboard components and design theory for reporting
  • Power Query concepts for data transformation and query loading
  • Pivot Table logic for summarising and analysing datasets
  • Techniques for dynamic reporting without manual formula use
  • Downloadable example resources to support your study

Each module is designed to help learners understand the principles behind Excel’s advanced capabilities, enabling you to conceptualise automation logic and reporting workflows used in accounting, business analysis, and data management.

Whether you’re enhancing your professional reporting skills, improving financial model thinking, or strengthening your Excel knowledge for career growth, this Excel automation and dashboard course provides a solid foundation. It’s suitable for learners seeking CPD‑aligned training in advanced formulas, VBA logic, and Power Query understanding. Enrol today!

Learning Outcomes

By the end of this Microsoft Excel: Automated Dashboard Using Advanced Formula, VBA, Power Query, you will be able to:

  • Apply advanced Excel formulas for financial and data models
  • Use VBA to automate repetitive spreadsheet tasks
  • Generate dynamic dashboards using Power Query and Pivot Tables
  • Structure and analyse complex datasets in Excel efficiently
  • Design automated reporting templates for professional use
  • Understand data workflow and dashboard logic for business reporting
  • Enhance productivity in accounting, finance, and business intelligence roles

Why Enrol in This Microsoft Excel Advanced Dashboard Course?

This Microsoft Excel: Automated Dashboard Using Advanced Formula, VBA, Power Query is ideal for professionals seeking to enhance their Excel capabilities beyond basic functions. It offers insights on automating financial models and creating interactive dashboards that can save time and improve reporting accuracy.

You’ll benefit from:

  • CPD-certified training tailored to accounting and data analysis professionals
  • Downloadable resources to practice and apply your skills
  • Flexible online learning with lifetime access

Following Courses are Included With This Course (For Free) - Limited Time!

Microsoft Azure Cloud Concepts(Gift Course)
Learn the Basics of Microsoft OneNote(Gift Course)

Who is This Microsoft Excel Advanced Dashboard Course For?

This Microsoft Excel: Automated Dashboard Using Advanced Formula, VBA, Power Query is suitable for:

  • Accountants and finance professionals
  • Business analysts and BI professionals
  • Data analysts managing reports and dashboards
  • Professionals automating financial and operational reporting
  • Excel users seeking CPD-accredited advanced training
  • Career switchers or students pursuing finance, analytics, or BI roles

Prerequisites

This Microsoft Excel: Automated Dashboard Using Advanced Formula, VBA, Power Query requires no prior experience to enrol. However, familiarity with formulas and Pivot Tables will help you get the most from this course.

Assessment Method

Assessment for the course is conducted through an automated multiple-choice exam. A score of 60% is required to pass and earn the CPD Accredited Certificate. Reflective assignments are provided to enhance your learning, with expert tutor feedback available.

Certification

Upon completing the Microsoft Excel: Automated Dashboard Using Advanced Formula, VBA, Power Query and passing the final exam, you will receive a CPD QS Accredited Certificate from Apex Learning. This certification demonstrates your knowledge and skills as a nursing assistant in the UK. The Digital version of the certificate is available for £9.99 only, and you can order a hard copy of the certificate for £14.99 only.

Apex - CPD QS Certificate Image
Microsoft Excel: Automated Dashboard Using Advanced Formula, VBA, Power Query Image 1
Microsoft Excel: Automated Dashboard Using Advanced Formula, VBA, Power Query Image 2
Microsoft Excel: Automated Dashboard Using Advanced Formula, VBA, Power Query Image 3

Career Path

Completing this Microsoft Excel: Automated Dashboard Using Advanced Formula, VBA, Power Query can enhance career prospects for Excel and data-focused roles in the UK. The following roles are commonly associated:

  • Financial Analyst – Build automated financial reports and dashboards.
    Average salary: £28,000 – £45,000
  • Business Intelligence Analyst – Develop dashboards and data visualisations to support business decisions.
    Average salary: £30,000 – £50,000
  • Accountant – Automate accounting tasks and financial reporting processes.
    Average salary: £25,000 – £40,000
  • Data Analyst – Analyse and interpret complex datasets with advanced Excel tools.
    Average salary: £27,000 – £45,000
  • Management Accountant – Design reporting templates and financial models for managerial decisions.
    Average salary: £30,000 – £48,000
  • Operations Analyst – Use Excel dashboards to monitor operational efficiency.
    Average salary: £30,000 – £50,000
  • Finance Officer – Apply advanced Excel for budget tracking and reporting.
    Average salary: £28,000 – £42,000
  • Reporting Analyst – Generate automated reports and visual dashboards for teams.
    Average salary: £30,000 – £45,000
  • Business Analyst – Extract actionable insights using Excel-based models.
    Average salary: £32,000 – £50,000
  • Project Analyst – Track project KPIs and automate reporting processes.
    Average salary: £30,000 – £48,000

Frequestly Asked Questions

This CPD-accredited course teaches advanced Excel techniques, including VBA, Power Query, and dynamic dashboard creation.

Yes. Beginners can enrol and gradually learn advanced formulas, Pivot Tables, and automation techniques suitable for finance, analytics, and reporting.

Learners will study advanced formulas, VBA macros, Pivot Tables, and Power Query for dynamic reporting and dashboard creation.

 Yes, the CPD QS Accredited Certificate is recognised by UK employers.

Yes. The course covers theoretical approaches to prepaid expense models, dashboard logic, and reporting workflows using Excel, Power Query, and VBA.

Yes. The course covers theoretical approaches to prepaid expense models, dashboard logic, and reporting workflows using Excel, Power Query, and VBA.

Yes. Advanced Excel, VBA, and dashboard skills improve efficiency and are highly sought after in finance, accounting, analytics, and business intelligence roles.

Ready to master advanced Excel dashboards, formulas, and automation? Enrol today and get instant access.

✔ Instant access 

✔ CPD accredited 

✔ Learn at your own pace

£21.99 for a Limited Time Only ✅Enrol Today!

Course Curriculum

Expand All

  • 13 sections
  • 26 lectures
  • 00:00:00 total length
Expand all sections
  • video Course Outline and Introduction
    00:04:00
  • video Minimum Requirements for the Course
    00:01:00
  • video Prepayments Introduction
    00:01:00

Microsoft Excel: Automated Dashboard Using Advanced Formula, VBA, Power Query

Microsoft Excel: Automated Dashboard Using Advanced Formula, VBA, Power Query

£21.99

Regular Price

£419

Save 95% - Sale Ends in

14 Days Money Back Guarantee

This course includes:

  • Duration:
    6 hours, 8 minutes
  • Access:
    1 year access
  • Level:
  • CPD Points:
    10