








Self-Paced Online learning
24/7 Online Support
14 days Money Back Guarantee
Fully Accredited Courses

Data Visualization and Reporting with Power BI

4.8

(276 students)
Bestseller Great Service Highly Rated Trending
Last updated: June 18, 2026
Language: English

Data Visualization and Reporting with Power BI

4.8

(276 students)
qls-logo cpd-logo cpd-logo ukrlp-logo iphm-logo

Rated Excellent on

google-logo

UNLOCK THIS COURSE AND 3000+ OTHER COURSES FOR ONLY £99! FIND OUT MORE

Data Visualization and Reporting with Power BI | CPD Accredited Course Online – UK

Transform raw business data into powerful dashboards that drive smarter decisions.

Looking to turn confusing spreadsheets, scattered reports and raw numbers into clear business insights? Data Visualization and Reporting with Power BI helps you build the reporting, dashboard design, data modelling and business intelligence skills modern employers value. Learn how Power BI Desktop, Power Query, DAX, Python integration, Power BI Service, data storytelling and row-level security work together to create smarter reporting systems.

Demand for skilled candidates hasn’t disappeared—it’s become more selective. The UK recorded 711,000 vacancies in early 2026, meaning stronger digital skills are essential to stand out. Power BI remains a key workplace tool, enabling self-service and enterprise business intelligence for connecting, visualising, and sharing data. UK salary data reflects its value: Glassdoor reports an average £40,213 for Power BI Analysts, while IT Jobs Watch shows a £45,000 median.

In this Power BI online course, you’ll learn to clean and transform data, build data models, create interactive dashboards, and write essential DAX formulas including CALCULATE. Gain skills to publish reports on Power BI Cloud, implement row-level security, and share insights securely. Start today to enhance your reporting expertise and make your CV stand out to employers. 

Course Overview

Data Visualization and Reporting with Power BI is a career-focused Power BI course for learners who want to create dashboards, reports and business intelligence visuals from real data. It suits beginners, career changers, analysts, office professionals, managers and business users who want stronger data reporting skills without wasting time on random tutorials.

Structured into specialised modules, this Power BI training online covers key reporting systems and analytics techniques, including:

  • Power BI Desktop setup, interface navigation, and connecting to multiple data sources
  • Data cleaning, transformation with Power Query, and advanced dataset preparation
  • Data modelling, relationships, report structure, and dashboard design techniques
  • DAX essentials, including the CALCULATE function, for powerful calculations
  • Data visualization, storytelling, and interactive dashboard creation for business insights
  • Power BI Service: cloud publishing, sharing reports, and row-level security for controlled access
  • Optional integration with Python for deeper data analysis and advanced reporting

Each module helps learners build job-ready knowledge for data transformation, dashboard creation, visual reporting, data models, DAX formulas, cloud publishing and secure report sharing.

After completing Data Visualization and Reporting with Power BI, learners can create interactive dashboards, clean business data, build structured reports, apply essential DAX and publish insights through Power BI Service.

These skills support roles in business intelligence, data analysis, finance reporting, sales reporting, operations analysis, HR analytics, marketing analytics, project reporting and management dashboards.

The level suits beginners and intermediate learners. You do not need previous Power BI experience, although Excel users, admin professionals and analysts can use the training to upgrade their reporting workflow.

Learners gain stronger dashboard confidence, better data judgement, improved CV value, clearer reporting ability and a stronger understanding of modern business intelligence standards.

The programme includes CPD Accredited certification, instant digital certificate access, optional hard copy certificate, 12 months unlimited access, weekday tutor support and flexible self-paced study.

Enrol in Data Visualization and Reporting with Power BI today and learn how to turn data into reports decision-makers actually understand.

Learning Outcomes of this Data Visualization and Reporting with Power BI course

Data Visualization and Reporting with Power BI develop confident Power BI, data reporting and dashboard skills for business intelligence, analytics and workplace decision-making roles.

  • Connect data sources for cleaner reporting workflows
  • Transform messy data using Power Query tools
  • Build relationships across tables with data models
  • Design interactive dashboards that explain business performance
  • Create clear visuals for faster management decisions
  • Apply DAX formulas for stronger analytical reporting
  • Use CALCULATE to build smarter business measures
  • Publish reports through Power BI Service securely
  • Set row-level security for controlled data access
  • Integrate Python features for enhanced data analysis
  • Tell stronger stories through visual data presentation
  • Strengthen CV value for analytics-focused roles

Following Courses are Included With This Course (For Free) - Limited Time!

Basic Data Handling & Visualisation with Excel & Google Sheets course for Free as gift with Data Visualization and Reporting with Power BI course
Data Center Training Essentials: General Introduction course for Free as gift with Data Visualization and Reporting with Power BI course

Why Enrol in this Data Visualization and Reporting with Power BI Course

Data Visualization and Reporting with Power BI helps you build essential, career-focused knowledge for dashboard creation, data reporting, business intelligence and analytics roles, giving you the confidence and subject understanding employers increasingly value.

  • CPD Accredited certification, supporting your progression into data, reporting and BI roles
  • Study a Power BI online course with 12 months unlimited access – learn anytime, anywhere
  • Gain a career-focused qualification to strengthen your CV and support progression into analytics-related roles
  • Instant digital certificate upon completion, with the option to order a hard copy
  • Receive a free student ID card to enhance your learner profile
  • Flexible, self-paced learning with no deadlines, ideal for busy learners
  • Transparent pricing with no hidden fees
  • Access dedicated tutor support on weekdays throughout your learning journey
  • Fast assessment and instant results, helping you progress quickly

Who is This Data Visualization and Reporting with Power BI Course for?

Data Visualization and Reporting with Power BI is ideal for learners who want stronger Power BI, dashboard reporting and business intelligence skills for modern data-focused roles.

  • Beginners aiming to enter data reporting roles confidently
  • Excel users upgrading into Power BI dashboards online
  • Data analysts improving dashboard and reporting skills
  • Managers needing clearer business intelligence reporting workflows
  • Finance staff building stronger reporting automation confidence
  • Marketing professionals tracking campaign data more clearly
  • HR teams creating workforce dashboards and reports
  • Career changers targeting analytics and BI opportunities

Prerequisites

There are no specific entry requirements for this Data Visualization and Reporting with Power BI course. It is open to:

  • Beginners interested in Power BI, dashboards and business reporting
  • Individuals exploring careers in data analysis, reporting or business intelligence
  • Professionals seeking CPD in data visualisation, Power Query and DAX
  • Anyone interested in understanding data cleaning, dashboard creation, cloud publishing and secure report sharing

How is the Data Visualization and Reporting with Power BI Assessed?

To assess your understanding, the programme includes a multiple-choice quiz that requires a passing score of 60%. In addition, you will have the opportunity to complete assignments that reinforce your learning across Power BI Desktop, Power Query, data modelling, dashboard creation, data visualization, DAX, Power BI Service and row-level security.

Expert tutors will provide feedback, helping you improve your reporting knowledge, refine your dashboard-building skills and complete the programme with stronger confidence.

Certification

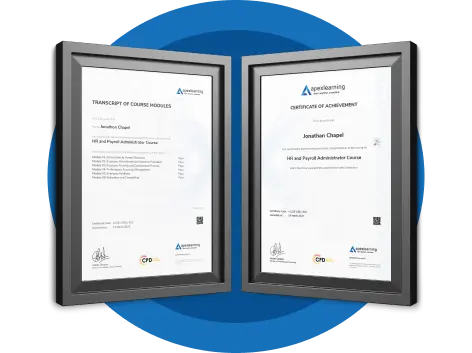
Upon completing the Data Visualization and Reporting with Power BI course and passing the final exam, you will receive a CPD QS Accredited Certificate from Apex Learning. This certification demonstrates your qualifications and skills. The Digital version of the certificate is available for a discounted price of £9.99 only, and you can order a hard copy of the certificate for a discounted price of £14.99 only.


📍Note: Discounted certificate pricing is available for a limited time only. Secure yours before the offer ends!
Apex - CPD QS Certificate Image
Data Visualization and Reporting with Power BI

Career Path

Power BI skills support data, reporting and analytics roles across finance, marketing, operations, HR, healthcare, retail and technology.

Upon completion of the Data Visualization and Reporting with Power BI course, you can pursue a variety of career opportunities in data analysis, reporting, and business intelligence, including: 

Power BI Analyst

  • Create dashboards, clean data, build reports, connect sources, explain trends and support decisions across finance, sales, operations or leadership.
    Estimated salary range: £33,000–£49,000 per year

Data Analyst

  • Collect, organise and interpret business data using Power BI, Excel and reporting tools to identify trends, risks and opportunities.
    Estimated salary range: £24,000–£44,000 per year

Business Intelligence Analyst

  • Turn company data into dashboards, reports and insight models, working with stakeholders to monitor performance and support strategic planning.
    Estimated salary range: £35,000–£55,000 per year

Reporting Analyst

  • Build scheduled reports, monitor KPIs, clean datasets and present clear business results for operational, finance, sales or compliance teams.
    Estimated salary range: £28,000–£45,000 per year

Power BI Developer

  • Design advanced Power BI models, dashboards, reports and secure solutions using DAX, Power Query and data relationships for business intelligence.
    Estimated salary range: £45,000–£70,000 per year

Dashboard Developer

  • Create interactive dashboards that track business performance, visualise trends, connect datasets and help teams understand complex information quickly.
    Estimated salary range: £32,000–£55,000 per year

Junior Data Analyst

  • Support data cleaning, reporting, dashboards and basic analysis while learning Power BI workflows under guidance of senior analysts.
    Estimated salary range: £22,000–£32,000 per year

Finance Reporting Analyst

  • Create financial dashboards, track budgets, analyse costs and support monthly reporting to help finance teams monitor performance trends.
    Estimated salary range: £32,000–£52,000 per year

Sales Operations Analyst

  • Track sales activity, pipeline, revenue and customer data using dashboards to support sales leaders and improve team productivity.
    Estimated salary range: £30,000–£50,000 per year

Marketing Data Analyst

  • Measure campaigns, customer behaviour, website metrics and channel performance while creating dashboards to show ROI and marketing impact.
    Estimated salary range: £28,000–£48,000 per year

Operations Analyst

  • Analyse workflow, productivity, service levels and process performance using Power BI dashboards to improve planning and operational efficiency.
    Estimated salary range: £30,000–£50,000 per year

HR Data Analyst

  • Track workforce data, absences, recruitment metrics and employee reports using Power BI dashboards to support HR decision-making.
    Estimated salary range: £30,000–£48,000 per year

Frequently Asked Questions

Yes. Data Visualization and Reporting with Power BI starts with Power BI Desktop, installation, interface navigation and mini projects before moving into Power Query, dashboards, data models and DAX. Beginners can build confidence step by step while gaining reporting skills for real workplace tasks.

You will learn data transformation, Power Query, data modelling, dashboard design, visual reporting, DAX essentials, CALCULATE, Power BI Service, Python integration, storytelling with data and row-level security. These skills help you create clearer reports and stronger business intelligence outputs.

Yes. The online format lets you study from home, around work or during free time. You can revisit lessons, build knowledge at your own pace and develop Power BI dashboard skills without fixed classroom schedules or travel.

Yes. Employers value people who can clean data, create dashboards and explain performance clearly. Power BI skills can strengthen your CV for data analyst, reporting analyst, business intelligence, finance reporting, operations and marketing analytics roles.

Yes. The curriculum includes DAX essentials and the CALCULATE function, two important areas for stronger Power BI analysis. These topics help learners create measures, improve reporting logic and build dashboards that answer sharper business questions.

Absolutely. Power BI helps teams connect data, create visuals, monitor KPIs and share reports through cloud services. Microsoft describes Power BI as a platform for self-service and enterprise business intelligence, which makes it highly relevant for workplace reporting. 

Yes. The curriculum covers Power BI Service, also known as Power BI Cloud. Learners explore how reports move beyond desktop files, so teams can publish, access and share business intelligence outputs more effectively.

Yes. The curriculum includes row-level security, which helps control who can view specific data in reports. That skill matters when organisations share dashboards across departments, managers, clients or teams with different access needs.

You can target roles such as Power BI Analyst, Data Analyst, Reporting Analyst, BI Analyst, Dashboard Developer, Finance Reporting Analyst, Sales Operations Analyst, Marketing Data Analyst and HR Data Analyst. Actual opportunities depend on experience, portfolio and interview performance.

Power BI remains valuable because reporting skills help employers make faster, clearer decisions. Recent UK benchmarks show Power BI Analyst average pay around £40,213 on Glassdoor, while IT Jobs Watch reports a £45,000 median salary from recent job adverts. 

No. Coding knowledge helps later, but beginners can start with Power BI Desktop, Power Query and visual dashboards first. The curriculum also introduces Python integration, so learners can understand how coding can extend analysis when they feel ready.

Random tutorials often teach isolated tricks without a clear path. Structured Power BI training guides you from setup and data transformation to dashboards, modelling, DAX, cloud publishing and security, helping you build stronger reporting confidence with less wasted effort.

Ready to start transforming data into insights? Join our Data Visualization and Reporting with Power BI course today and get instant access.

✔ Instant access 

✔ CPD accredited 

✔ Learn at your own pace

£21.99 for a Limited Time Only ✅Enrol Today!

Course Curriculum

Expand All

  • 15 sections
  • 30 lectures
  • 00:00:00 total length
Expand all sections
  • video Welcome!
    00:01:00
  • video What is Power BI?
    00:03:00
  • video Download & Installing Power BI Desktop
    00:04:00
  • video Getting to know the interface
    00:03:00
  • video Mini Project: Transform Data
    00:07:00
  • video Mini Project: Visualize Data
    00:05:00
  • video Mini Project: Creating a Data Model
    00:07:00
  • video Course Outline: What will you learn in this course?
    00:05:00
  • video How to learn best with this course?
    00:03:00

Data Visualization and Reporting with Power BI

Data Visualization and Reporting with Power BI

£21.99

Regular Price

£419

Save 95% - Sale Ends in

14 Days Money Back Guarantee

This course includes:

  • Duration:
    14 hours, 25 minutes
  • Access:
    1 year access
  • Level:
  • CPD Points:
    10