



Self-Paced Online learning
24/7 Online Support
14 days Money Back Guarantee
Fully Accredited Courses

Data Analytics with Tableau

5

(1503 students)
Bestseller Great Service Highly Rated Trending
Last updated: July 8, 2026
Language: English

Data Analytics with Tableau

5

(1503 students)
qls-logo cpd-logo cpd-logo ukrlp-logo iphm-logo

Rated Excellent on

google-logo

UNLOCK THIS COURSE AND 3000+ OTHER COURSES FOR ONLY £99! FIND OUT MORE

Discover how data analytics with Tableau transforms messy spreadsheets into clear, actionable insights- no experience needed.

Why drown in rows of data when Tableau can show you precisely where a business is growing, where it is losing money, and what decision should come next? The Data Analytics with Tableau Course helps you understand how Tableau is used to prepare data, build dashboards, analyse trends and communicate business insights clearly. 

The GOV.UK reports that 46% of businesses have struggled to recruit for roles requiring data skills, underscoring how essential clear data understanding has become in UK workplaces. This CPD‑accredited Data Analytics with Tableau Course responds to that need by teaching Tableau through sales, HR, shipping, stock price and business reporting examples so you can prepare messy data, build dashboards, perform visual analysis and craft Tableau Stories that make insights easy to act on. 

By focusing on employer‑relevant techniques and portfolio pieces, the Data Analytics with Tableau Course helps you turn scattered numbers into faster decisions, reduce missed opportunities and present findings that influence real business outcomes.

Course Overview

Structured into specialised modules, this Data Analytics with Tableau Course covers essential data analytics and visualisation concepts, including:

  • Introduction to Tableau and how the course is structured
  • Installing and understanding the Tableau environment
  • Sales and profit analytics using the Discount Mart project
  • HR analytics through the Green Destinations project
  • Sales agent tracking using the Superstore project
  • Shipping analytics with the Northwind Trade project
  • Stock price analytics using the Tesla project
  • Introduction to database concepts
  • Tableau Stories for presenting data insights
  • Dashboard creation, visual reporting and interpretation techniques

Each module is designed to help learners understand how Tableau can be used to turn raw information into clearer reports, dashboards and visual stories. You’ll explore how data can be organised, analysed and presented in ways that support business conversations and decision-making.

Whether you’re aiming to move into data analytics, improve reporting knowledge, or understand Tableau for business intelligence work, this course provides a professional foundation. It is suitable for beginners, career changers and professionals who want to build confidence with Tableau-based analytics.

By completing this Data Analytics with Tableau Course, you’ll gain CPD-accredited knowledge that supports your Continuing Professional Development in data analytics, business intelligence and reporting. It can also act as a useful stepping stone if you want to explore data-focused roles. Enrol today!

By completing the Data Analytics with Tableau course, you will be able to:

  • Explain key data analytics concepts and their business applications
  • Navigate Tableau’s environment and use its core functionalities
  • Prepare and organise datasets for effective analysis
  • Design compelling and interactive dashboards
  • Analyse data visually to support decision-making
  • Interpret analytical outputs with accuracy
  • Understand UK data protection regulations relevant to analytics
  • Communicate data insights clearly to stakeholders

This Data Analytics with Tableau Course is expertly designed to provide UK learners with an academic understanding of data analytics supported by Tableau’s powerful visualisation capabilities.

You’ll benefit from:

  • CPD-accredited training recognised by UK data and business professionals
  • Comprehensive curriculum covering both analytics theory and Tableau software
  • Flexible online learning accessible across the UK
  • Preparation for careers in data analysis, business intelligence, and reporting
  • A strong foundation for further specialisation in data science and analytics

This Data Analytics with Tableau Course is ideal for:

  • Aspiring data analysts and business intelligence professionals
  • Data scientists seeking foundational Tableau knowledge
  • Business managers and decision-makers
  • Students and professionals aiming to boost their analytical skills
  • Anyone interested in mastering data visualisation within the UK context

Basic knowledge of data concepts or prior experience with spreadsheets is beneficial but not essential. The Data Analytics with Tableau course welcomes learners at all levels.

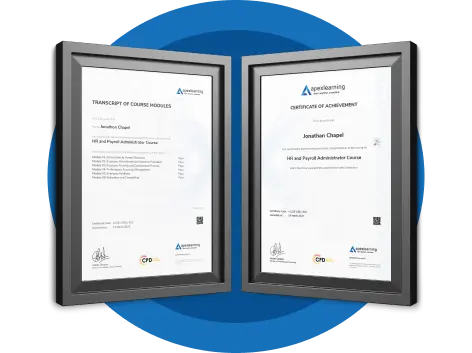
Upon completing the course and passing the final exam, you will receive a CPD QS Accredited Certificate from Apex Learning. This certification demonstrates your qualifications and skills. The Digital version of the certificate is available for a discounted price of £9.99 only, and you can order a hard copy of the certificate for a discounted price of £14.99 only.


📍Note: Discounted certificate pricing is available for a limited time only. Secure yours before the offer ends!
Apex - CPD QS Certificate Image

Upon successful completion of the course, learners can order a QLS Endorsed Certificate as recognition of their achievement. QLS Endorsed Certificates are available for an additional fee based on the qualification level, plus a £10 postage charge for international delivery.

QLS Certificate Homepage Section

Completing the Data Analytics with Tableau Course can support your understanding of data analytics, visual reporting and business intelligence roles. The salary ranges below are indicative and may vary by location, experience, employer and sector.

Data Analyst

  • Interpret data, identify trends and create reports that support business decision-making.
  • Average salary: £28,000 – £65,000

Business Intelligence Analyst

  • Use dashboards and visual reporting tools to help organisations understand performance and opportunities.
  • Average salary: £30,000 – £55,000

Reporting Analyst

  • Prepare structured reports and visual summaries for managers, teams and stakeholders.
  • Average salary: £29,000 – £47,000

Tableau Reporting Assistant

  • Support dashboard updates, visual reporting tasks and basic Tableau-based data presentation.
  • Average salary: £24,000 – £35,000

Data Visualisation Specialist

  • Present complex data in clear charts, dashboards and visual formats for business users.
  • Average salary: £32,000 – £55,000

Business Analyst

  • Investigate business problems and use data insights to support process and performance improvements.
  • Average salary: £23,000 – £55,000

Market Research Data Analyst

  • Analyse market, customer or survey data to identify patterns, trends and opportunities.
  • Average salary: £24,000 – £50,000

Operations Analyst

  • Review operational data to help teams understand workflow, efficiency and service performance.
  • Average salary: £28,000 – £45,000

HR Data Analyst

  • Analyse workforce data, staff trends and HR metrics to support people-focused decisions.
  • Average salary: £28,000 – £45,000

Junior Data Scientist

  • Support data analysis, modelling and insight work using structured data and analytical thinking.
  • Average salary: £32,000 – £50,000

Data Analytics with Tableau Course

Discover how data analytics with Tableau transforms messy spreadsheets into clear, actionable insights- no experience needed.

Why drown in rows of data when Tableau can show you precisely where a business is growing, where it is losing money, and what decision should come next? The Data Analytics with Tableau Course helps you understand how Tableau is used to prepare data, build dashboards, analyse trends and communicate business insights clearly. 

The GOV.UK reports that 46% of businesses have struggled to recruit for roles requiring data skills, underscoring how essential clear data understanding has become in UK workplaces. This CPD‑accredited Data Analytics with Tableau Course responds to that need by teaching Tableau through sales, HR, shipping, stock price and business reporting examples so you can prepare messy data, build dashboards, perform visual analysis and craft Tableau Stories that make insights easy to act on. 

By focusing on employer‑relevant techniques and portfolio pieces, the Data Analytics with Tableau Course helps you turn scattered numbers into faster decisions, reduce missed opportunities and present findings that influence real business outcomes.

Course Overview

Structured into specialised modules, this Data Analytics with Tableau Course covers essential data analytics and visualisation concepts, including:

  • Introduction to Tableau and how the course is structured
  • Installing and understanding the Tableau environment
  • Sales and profit analytics using the Discount Mart project
  • HR analytics through the Green Destinations project
  • Sales agent tracking using the Superstore project
  • Shipping analytics with the Northwind Trade project
  • Stock price analytics using the Tesla project
  • Introduction to database concepts
  • Tableau Stories for presenting data insights
  • Dashboard creation, visual reporting and interpretation techniques

Each module is designed to help learners understand how Tableau can be used to turn raw information into clearer reports, dashboards and visual stories. You’ll explore how data can be organised, analysed and presented in ways that support business conversations and decision-making.

Whether you’re aiming to move into data analytics, improve reporting knowledge, or understand Tableau for business intelligence work, this course provides a professional foundation. It is suitable for beginners, career changers and professionals who want to build confidence with Tableau-based analytics.

By completing this Data Analytics with Tableau Course, you’ll gain CPD-accredited knowledge that supports your Continuing Professional Development in data analytics, business intelligence and reporting. It can also act as a useful stepping stone if you want to explore data-focused roles. Enrol today!

Learning Outcomes

By completing the Data Analytics with Tableau course, you will be able to:

  • Explain key data analytics concepts and their business applications
  • Navigate Tableau’s environment and use its core functionalities
  • Prepare and organise datasets for effective analysis
  • Design compelling and interactive dashboards
  • Analyse data visually to support decision-making
  • Interpret analytical outputs with accuracy
  • Understand UK data protection regulations relevant to analytics
  • Communicate data insights clearly to stakeholders

Following Courses are Included With This Course (For Free) - Limited Time!

Big Data Analytics with PySpark Tableau Desktop and MongoDB(Gift Course)
Excel Data Analysis for Beginner(Gift Course)

Why Enrol in This Data Analytics with Tableau Course?

This Data Analytics with Tableau Course is expertly designed to provide UK learners with an academic understanding of data analytics supported by Tableau’s powerful visualisation capabilities.

You’ll benefit from:

  • CPD-accredited training recognised by UK data and business professionals
  • Comprehensive curriculum covering both analytics theory and Tableau software
  • Flexible online learning accessible across the UK
  • Preparation for careers in data analysis, business intelligence, and reporting
  • A strong foundation for further specialisation in data science and analytics
Data Analytics with Tableau Image 1
Data Analytics with Tableau Image 2
Data Analytics with Tableau Image 3

Who is This Data Analytics with Tableau Course for?

This Data Analytics with Tableau Course is ideal for:

  • Aspiring data analysts and business intelligence professionals
  • Data scientists seeking foundational Tableau knowledge
  • Business managers and decision-makers
  • Students and professionals aiming to boost their analytical skills
  • Anyone interested in mastering data visualisation within the UK context

Prerequisites

Basic knowledge of data concepts or prior experience with spreadsheets is beneficial but not essential. The Data Analytics with Tableau course welcomes learners at all levels.

Assessment Method

Assessment for the course is conducted through an automated multiple-choice exam. A score of 60% is required to pass and earn the CPD Accredited Certificate. Reflective assignments are provided to enhance your learning, with expert tutor feedback available.

Certification

Upon completing the course and passing the final exam, you will receive a CPD QS Accredited Certificate from Apex Learning. This certification demonstrates your qualifications and skills. The Digital version of the certificate is available for a discounted price of £9.99 only, and you can order a hard copy of the certificate for a discounted price of £14.99 only.


📍Note: Discounted certificate pricing is available for a limited time only. Secure yours before the offer ends!
Apex - CPD QS Certificate Image

Endorsed Certificate from the Quality Licence Scheme

Upon successful completion of the course, learners can order a QLS Endorsed Certificate as recognition of their achievement. QLS Endorsed Certificates are available for an additional fee based on the qualification level, plus a £10 postage charge for international delivery.

QLS Certificate Homepage Section

Career Path

Completing the Data Analytics with Tableau Course can support your understanding of data analytics, visual reporting and business intelligence roles. The salary ranges below are indicative and may vary by location, experience, employer and sector.

Data Analyst

  • Interpret data, identify trends and create reports that support business decision-making.
  • Average salary: £28,000 – £65,000

Business Intelligence Analyst

  • Use dashboards and visual reporting tools to help organisations understand performance and opportunities.
  • Average salary: £30,000 – £55,000

Reporting Analyst

  • Prepare structured reports and visual summaries for managers, teams and stakeholders.
  • Average salary: £29,000 – £47,000

Tableau Reporting Assistant

  • Support dashboard updates, visual reporting tasks and basic Tableau-based data presentation.
  • Average salary: £24,000 – £35,000

Data Visualisation Specialist

  • Present complex data in clear charts, dashboards and visual formats for business users.
  • Average salary: £32,000 – £55,000

Business Analyst

  • Investigate business problems and use data insights to support process and performance improvements.
  • Average salary: £23,000 – £55,000

Market Research Data Analyst

  • Analyse market, customer or survey data to identify patterns, trends and opportunities.
  • Average salary: £24,000 – £50,000

Operations Analyst

  • Review operational data to help teams understand workflow, efficiency and service performance.
  • Average salary: £28,000 – £45,000

HR Data Analyst

  • Analyse workforce data, staff trends and HR metrics to support people-focused decisions.
  • Average salary: £28,000 – £45,000

Junior Data Scientist

  • Support data analysis, modelling and insight work using structured data and analytical thinking.
  • Average salary: £32,000 – £50,000

FAQs: Data Analytics with Tableau Course

Data analytics with Tableau means using Tableau to turn raw data into visual reports, dashboards and clear business insights. It helps users explore patterns, compare performance and present information in a way that is easier to understand.

Yes, Tableau is widely used for data analytics, especially for data visualisation, dashboards and business intelligence reporting. It helps professionals organise information, identify trends and communicate findings more clearly. This course helps learners understand how Tableau supports data analysis and decision-making.

The Data Analytics with Tableau is a CPD-accredited online course that introduces Tableau, dashboard creation, visual analytics and data interpretation. It uses project examples such as sales, HR, shipping and stock price analytics to help learners understand how Tableau supports business reporting.

No previous Tableau experience is required to enrol in the Data Analytics with Tableau Course. The course starts with an introduction to Tableau, course structure and installation before moving into project-based analytics examples. Basic spreadsheet or data awareness may help, but it is not essential.

Yes, this course is suitable for beginners who want to understand Tableau and data analytics concepts. It is also useful for professionals who already work with reports or business data and want to strengthen their understanding of visual analytics.

Yes, it can support your learning journey by building CPD-accredited knowledge of Tableau, dashboards and data interpretation. It does not guarantee employment, but it can act as a useful stepping stone for learners exploring data analytics, reporting or business intelligence roles.


Yes, the curriculum includes Tableau Stories. This helps learners understand how data findings can be arranged into a clear narrative, making insights easier to communicate to managers, teams and stakeholders.

Yes, the Data Analytics with Tableau Course is relevant for UK learners interested in data analytics, reporting and business intelligence. It supports awareness of how Tableau can help professionals interpret data and present business insights clearly.

Ready to explore data analytics with Tableau? Enrol today and get instant access.

✔ Instant access 

✔ CPD accredited 

✔ Learn at your own pace

£21.99 for a Limited Time Only ✅Enrol Today!

Course Curriculum

Expand All

  • 10 sections
  • 20 lectures
  • 00:00:00 total length
Expand all sections
  • video Introduction to the Course
    00:02:00
  • video What is Tableau? An Introduction to Tableau
    00:03:00
  • video How this course is Structured
    00:01:00
  • video Installing the Free Full Version of Tableau
    00:02:00

Data Analytics with Tableau

Data Analytics with Tableau

£21.99

Regular Price

£419

Save 95% - Sale Ends in

14 Days Money Back Guarantee

This course includes:

  • Duration:
    6 hours, 47 minutes
  • Access:
    1 year access
  • Level:
  • CPD Points:
    10